Structure for Acifluorfen:

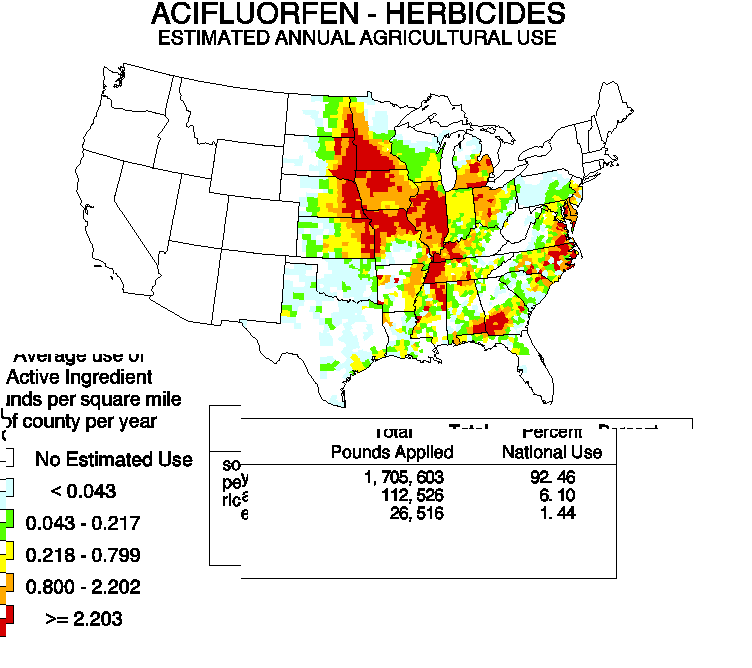
This map is from the Pesticide National Synthesis Project of the U. S. Geological Survey's National Water Quality Assessment Program. The pesticide use maps show regional-scale patterns of use intensity within the United States and are not intended for making local-scale estimates of pesticide use, such as for individual counties. The maps are based state-level estimates of pesticide use rates for individual crops, which have been compiled by the National Center for Food and Agricultural Policy (NCFAP) for 1995-1998, and on 1997 Census of Agriculture county crop acreage. Key limitations include: (1) state use-coefficients represent an average for the entire state and consequently do not reflect the local variability of pesticide management practices found within many states and counties, and (2) the county-level acreage are based on the 1997 Census of Agriculture and may not represent all crop acreage due to Census non-disclosure rules. Please refer to Method for Estimating Pesticide Use for a detailed discussion of how the pesticide use data were developed.
This
map is available at
http://ca.water.usgs.gov/cgi-bin/pnsp/pesticide_use_maps_1997.pl?map=W1002
 See
also US
map of Acifluorfen use based on 1992-1995 data
See
also US
map of Acifluorfen use based on 1992-1995 data
All pesticides
Maps complied for 1995-1998 data are available at:
http://ca.water.usgs.gov/pnsp/pesticide_use_maps_1997/