FLUORIDE ACTION NETWORK PESTICIDE PROJECT
Natural
Levels of Fluoride in Drinking Water by State:
Kansas
• It is not known if the water systems listed below are all still active
• The state Water System ID is the same as EPA's preceded with the state's initial. For example, Kansas would be KS0000000
Information
from:
Fluoridation Census 1992. Volume 1.
Published
1993
by
U.S. Department of Health & Human Services
Public Health Service
Centers for Disease Control and Prevention Services
Naional Center for Prevention Services
Division of Oral Health
Atlanta, Georgia 30333
Return to Index: Natural Levels of Fluoride in US Drinking Water
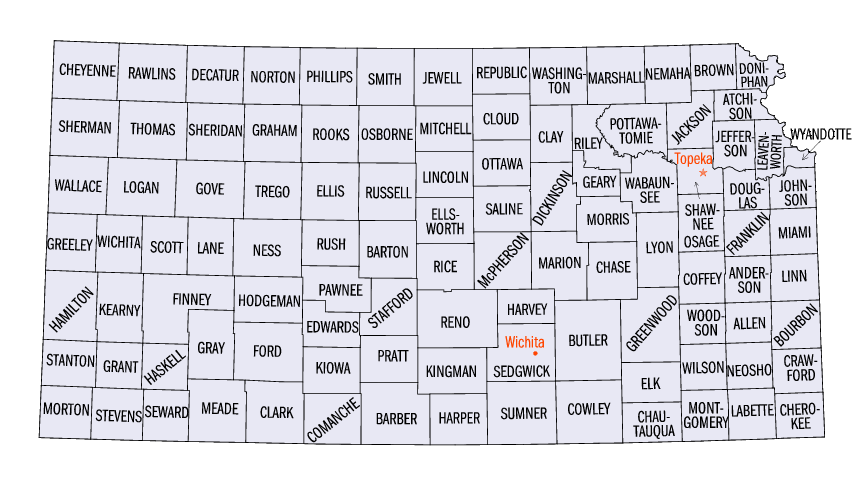
See map from U.S. Census Bureau with links to each county in Kansas
| State | Water Systems | County | EPA ID No. | Population | Natural Level of Fluoride (ppm) |
| Kansas | Burns | Marion | 2011501 | 226 | 2.2 |
| Kansas | Colby | Thomas | 2019302 | 5,396 | 1.6 |
| Kansas | Dighton | Lane | 2010101 | 1,361 | 2.6 |
| Kansas | Dodge City | Ford | 2005710 | 21,129 | 2.4 |
| Kansas | Goodland | Sherman | 2018102 | 4,983 | 1.5 |
| Kansas | Oldmitz | Barton | 0000060 | 130 | 2.0 |
FYI
| Percentage of State Population served by Public Water Systems that Receive Fluoridated Water (see all states) | ||||||
| State | 2004 | 2003 | 2002 | 2001 | 2000 | 1992 |
| Kansas | 62.1 | 63.0 | 62.5 | 62.5 | 62.5 | 58.4 |
Return to Index: Natural Levels of Fluoride in US Drinking Water