FLUORIDE ACTION NETWORK PESTICIDE PROJECT
Natural
Levels of Fluoride in Drinking Water by State:
Oklahoma
• It is not known if the water systems listed below
-- remove fluoride at levels over 4.0 ppm
-- are all still active
• The state Water System ID is the same as EPA's preceded with the state's initial. For example, Oklahoma would be OK0000000
Information
from:
Fluoridation Census 1992. Volume 1.
Published
1993
by
U.S. Department of Health & Human Services
Public Health Service
Centers for Disease Control and Prevention Services
Naional Center for Prevention Services
Division of Oral Health
Atlanta, Georgia 30333
Return to Index: Natural Levels of Fluoride in US Drinking Water

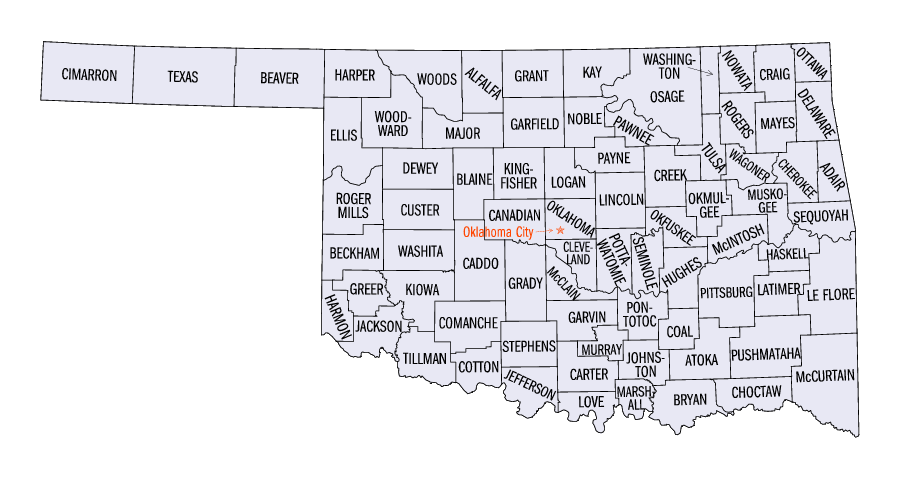
See map from U.S. Census Bureau with links to each county in Oklahoma
| State | Water Systems | County | EPA ID No. | Population | Natural Level of Fluoride (ppm) |
| Oklahoma | Adams RWD 1 |
Texas | 2007010 | 135 | 1.5 |
| Oklahoma | Beaver RWD 1 (Turpin) | Beaver | 2000402 | 490 | 1.6 |
| Oklahoma | Bluejacket | Craig | 260 | 4.4 | |
| Oklahoma | Bowlegs Lima Water District | Seminole | 2006701 | 1,850 | 3.6 |
| Oklahoma | Bowlegs Water Works | Seminole | 2006707 | 150 | 4.6 |
| Oklahoma | Cache | Comanche | 2001607 | 1,800 | 5.4 |
| Oklahoma | Calumet | Canadian | 2000904 | 600 | 1.6 |
| Oklahoma | Deer Creek Water Corp | Oklahoma | 2000504 | 1,900 | 3.8 |
| Oklahoma | Delhi | Beckham | 2000507 | 60 | 7.0 |
| Oklahoma | Geronimo | Comanche | 2001611 | 1,200 | 12.0 |
| Oklahoma | Goodwell | Texas | 2007005 | 1,186 | 2.0 |
| Oklahoma | Guyman | Texas | 2007003 | 8,492 | 1.9 |
| Oklahoma | Indiahoma | Comanche | 2001609 | 425 | 10.2 |
| Oklahoma | Lakemont Shores | Delaware | 2002170 | 90 | 2.3 |
| Oklahoma | Maud | Seminole | 2006302 | 1,251 | 3.7 |
| Oklahoma | Miami | Otawa | 2005813 | 15,000 | 5.4 |
| Oklahoma | Monkey Island Airport Resort | Delaware | 2002167 | 50 | 1.5 |
| Oklahoma | Northwest Central Pipeline | Texas | 2007012 | 125 | 1.7 |
| Oklahoma | Panhandle St University | Texas | 2007001 | 1,200 | 2.5 |
| Oklahoma | Peels MHP | Seminole | 2006706 | 70 | 1.7 |
| Oklahoma | Ratcliff City | Carter | 2001002 | 350 | 1.5 |
| Oklahoma | Shangri-La | Delaware | 2002136 | 175 | 1.6 |
| Oklahoma | Sunset Hills Subdivision | Delaware | 2002133 | 45 | 1.7 |
| Oklahoma | Texas Co RWD #2 | Texas | 2007004 | 243 | 1.9 |
| Oklahoma | Texhoma | Texas | 2007009 | 800 | 1.6 |
| Oklahoma | Wellston | Lincoln | 2004140 | 900 | 2.3 |
FYI
| Percentage of State Population served by Public Water Systems that Receive Fluoridated Water (see all states) | ||||||
| State | 2004 | 2003 | 2002 | 2001 | 2000 | 1992 |
| Oklahoma | 74.6 | 75.0 | 74.6 | 74.6 | 74.6 | 58.0 |
Return to Index: Natural Levels of Fluoride in US Drinking Water